Understanding Market Structure: The Foundation of ICT Trading Strategies
So, welcome back to this entire beginner-to-expert series on ICT trading strategies. From the last post, the site had put up an introduction to basic aspects of ICT and how they keep their value within the broader world of trading. So, now you are taking the ride into the first and most important of concepts: Market Structure.
When it comes down to it, market structure is the backbone of price action analysis regardless of whether you are trading forex, stocks, or crypto. It teaches you how to identify a trend, look for reversal points, and find highly probable setups. Learning market structures will lay down that foundation for you that is firm enough for any ICT strategy to come along with it.
What’s Market Structure?
Market structure means the way price moves and changes over periods of high and low levels. These patterns show the current trend of the market and possible turning points.
Some of the primary elements of market structure are:
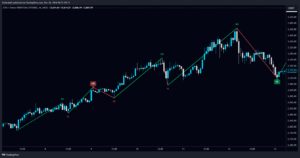
- Higher Highs and Higher Lows (Uptrend): Price moves upwards with each peak higher than and each trough above the previous one.
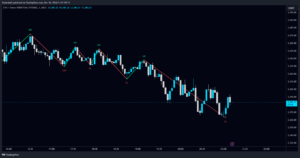
- Lower Highs and Lower Lows (Downtrend): Price drops down with each peak lower than and each trough below the previous one.
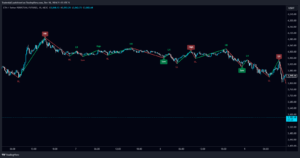
- Consolidation/Solid Sideways Market: Price moves inside ranges without a clear trend.
How Market Structure Affects ICT.
Market structure is integral to ICT strategies because it allows traders to:
- Identify the Trend: It will greatly matter to your trading where the market will then be trending upward, trending downward, or moving sideways.
- Identify Reversals: With a change in market structure (e.g., higher low breaking into a lower low), one could suspect a trend change.
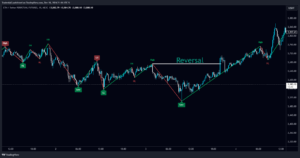
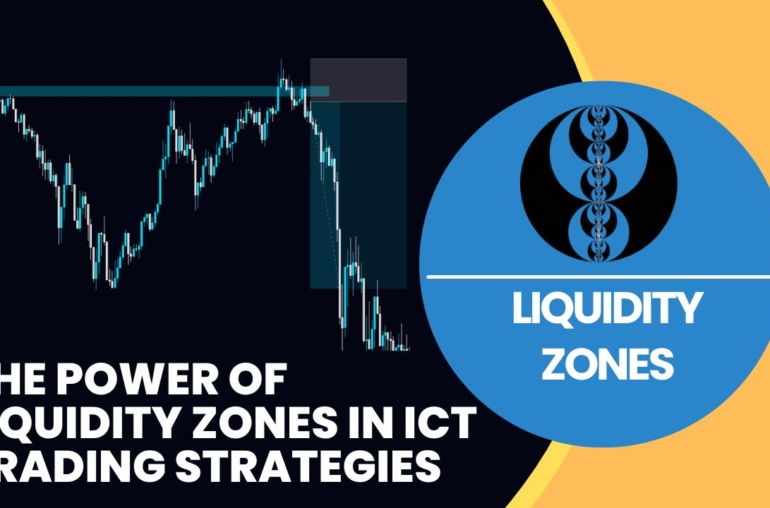
- Identify liquidity zones: Areas where price usually either reverses or accelerates are smart money concepts.
How to Read Market Structure:
A Stepwise Guide to Reading the Market Structure:
- Initiating from Higher Timeframes: Analyze weekly or daily charts for general trend comprehension.
- Identifying Swing Points: Note the newest higher high, higher low, lower high and lower low.
- Mark Key Levels: Draw support and resistance zones for marking the reaction of price.
- Zoom into the Lower Timeframe: This is for precise trade entries into 4-hour or 1-hour after identifying the trend.
Avoiding Common Mistakes
- Not minding Timeframes: As focusing on the smaller timeframes totally gives you a flat view of reality. The always major start in the higher timeframe.
- Complicating Charts: Keep your analysis clean: clear high and lows.
- Chasing Price: Enter only when you have a confirmation such as a break of structure.
Examples of Real Life: Spotting a Trend Reversal
For instance, if Bitcoin continues forming higher highs and higher lows on the daily, then price breaks the previous higher low and forms a lower high; this is a clear example of market structure shift indicating that it is potentially in a downtrend.
In the case of observing this shift, an adjustment of the trading plan becomes:
- Avoid long positions.
- Look for shorts toward resistance area.
- Actionable Strategies for the Trader
- Practice market structure marking on past charts to gain closeness to it.
- Combine market structure with other ICT concepts such as liquidity zones for better trade setups.
- Use free charting platforms like TradingView to annotate and save your analysis.
What is Next?
In the next post, we will cover Liquidity and Manipulation; these are the foundations of ICT strategies teaching you how to play it through institutional players.
Stay Updated! Bookmark this site, follow us on Twitter, and join our Discord for live updates and trade ideas. Keep learning.

