Liquidity and Manipulation: Understanding the Principles of ICT Trading
This is the third installment of our series on ICT trading strategies. The initial two parts cover the basics of ICT and the market structure that forms the bedrock of trading success. This article, however, will dive into the concepts of liquidity and manipulation two lifeblood’s that distinguish amateur traders from the pros.
Understanding liquidity lets you into the market thinking of the institutional players, or “smart money”. Being aware of where liquidity is and what it’s all about will disallow several retail traps and direct your trades in line with the direction of the market flows.
What Is Liquidity in Trading?
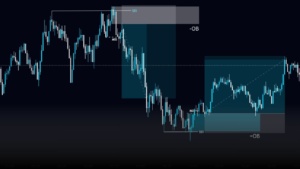
In simple terms, liquidity is the presence of buyers and sellers at certain price levels. These points are usually targets for institutional players that need lots of volume to clear their big orders.
Some popular liquidity zones are
- Stop-Loss Areas where traders have their stop-loss orders such as above swing highs or below swing lows.
- The Support and Resistance Levels – common areas where traders carry out their transactions at the onset or end of any trades.
- Order Blocks – This is a consolidation zone created as a result of institutional buying or selling.
How Smart Money Uses Liquidity
Smart money (mostly banks and large institutions) hunts liquidity to execute their trades. This is how manipulation works:
- Stop Hunts: Triggering stop-loss orders to create liquidity for their positions
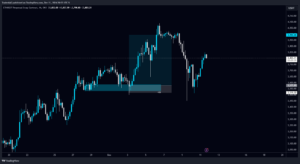
- False Breakouts: Pushing price beyond pre-defined levels just to trigger buy/sell orders of retail traders and reverse the movement
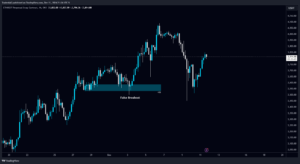
- Sweeping Liquidity: Pulling price up or down to hunt orders above or below obvious highs/lows and then continuing the trend
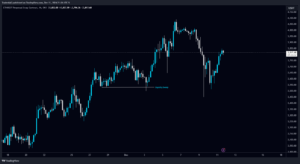
- In Practice: Real-life Example of Liquidity Manipulation
Real-World Example: Liquidity Manipulation in Action
Just suppose Bitcoin now trades around the $100,000 mark radiating the resistance level at $100,000. Most retail would tend to put stop-loss orders a little above $100,100 hoping that should make the resistance hold.
Smart money would see such a stop-order array as a liquidity pool, artificially pushing prices above $35,500 to activate the stops and generate buying pressure before turning the market around and selling at a higher price.
By doing this behavior, you to:
- Avoid trading at obvious levels.
- Confirm after the sweep of liquidity before taking a trade.
- Trade in line with institutional flows.
- Identifying Liquidity Zones
Here is a step-by-step guide for recognizing liquidity within your charts:
- Mark Swing Highs and Lows: In general, they act as magnets for liquidity.
- Indicate Consolidation Areas: Usually, price sweeps liquidity before leaving the construction.
- Hunt Stops: Sudden price spikes followed by sudden drops often signify a capture of liquidity.
- Higher Timeframes: Chances of more exact resistance zones in liquidity areas, especially daily or 4 hour, are much better.
Both the Subjects Liquidity and Market Structure
Liquidity and market structures usually invite each other. For instance:
- During the process of creating the next leg up, liquidity is often swept below higher lows in an uptrend.
- When in a downtrend, the area must show signs of liquidity grabs above lower highs.
You could filter your entries and exits at the trade entry points from combining these concepts in avoiding retail faulty practices.
Tips You Can Use for Trading
- Don’t set stop-loss orders at clear levels; make liquidity zones work for you.
- Mix liquidity analysis with market structure to create setups with high chances of success.
- Train yourself to spot stop hunts and fake breakouts on past charts.
What’s Coming Up?
Our next post will look into Smart Money Concepts. We’ll explore how big players work and how you can follow their lead in your trades.
Keep in Touch!
Save this site, follow our X, and join our Discord to get live updates and ideas for trades. We’ll keep learning ICT trading strategies together!


