FARTCOIN Hits All-Time High at $0.92: The Wave 4 Correction or Wave 5 Breakout?
Introduction:
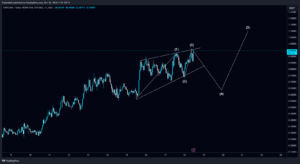
FARTCOIN, a fast catch-up star in the cryptocurrency market, has recently made a massive move that is indeed exciting investors. The meme coin breaks out to reach a new all-time high of $0.92 on December 17, which likely marks the completion of Wave 3 in its bullish 5-wave Elliott structure. Now, with clear signs of slowing momentum, all eyes are on the anticipated Wave 4 correction and what will transpire with Wave 5 afterward. Will FARTCOIN continue its bullish trend and break through the coveted $1.00 mark? Or will the market take a deeper turn?We will see it for ourselves.
FARTCOIN Price Analysis:
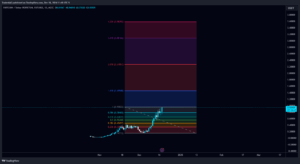
A daily chart is telling of a strong 5-wave bullish impulse that has elevated FARTCOIN’s price. Wave 3 hit its peak close to the 1.618 Fibonacci extension around $0.84-$0.92. Much of this wave was made possible due to bullish momentum after breaking out of the descending channel during Wave 2.
But now after the upturn peak of $0.92, the momentum is starting to cool. The relative Strength index (RSI) has indicated a somewhat overbought situation, indicating that a Wave 4 retracement could be expected. Based on historical precedence, Wave 4 consolidation would typically retrace between 0.236 and 0.618 Fibonacci levels before continuing with a further bullish move.

Key Levels to Watch
- Resistance Zones:
- $0.86-$0.92: This range represents an all-time high from recent past and is now another strong barricade zone for FARTCOIN. A successful breakout above this level will duly endorse wave 5 momentum that expects higher Fibonacci levels targeted.
- Support Zones:
- $0.74- (0.236 Fibonacci): Initial support for 4 wave correction,
- $0.62- (0.382 Fibonacci): Another important level to watch for consolidation.$0.53- (0.5 Fibonacci):
- Stronger support levels where buy interest will naturally swell.
- $0.44- (0.618 Fibonacci): This is deepest correction would invalidate the bullish wave structure.
Indicators Signal a Pullback
The daily RSI is still high which commonly results in an oversold state sometimes followed by corrective action. After some bearish divergence started showing on the hourly chart, we also get to continue putting weight into our arguments towards a Wave 4 pullback.
The Momentum Indicators also prove that the market is preparing for consolidation before the next upward movement. A bounce in the support range of $0.62-$0.53 will validate the initiation of Wave 5.
Wave 5 Price Prediction
FARTCOIN would have a bullish course after Wave 4 finally closes. Target Fibonacci extension levels on Wave 5 cuts across:
- $1.00 (2.0 extension): Psychological level and milestone into the coin.
- $1.10 (2.272 extension): A reach out target if bulls maintain strength.
- $1.27 (2.618 extension): Long-term target after Wave 5 Completion.

Bearish Scenario
The bullish trend applies to everything, although traders have to be more dangerous about the invalidation levels. A breakdown at the level of $0.44 could prolong the correction and revert FARTCOIN from its bullish trend.
Conclusion
FARTCOIN’s stellar run to $0.92 gives space for Wave 4 correction. Even though this indicates that consolidation will be short-term, the overall sentiment is expected to be hopeful for Wave 5.


